Berkshire Hathaway
50 Years of Berkshire Hathaway
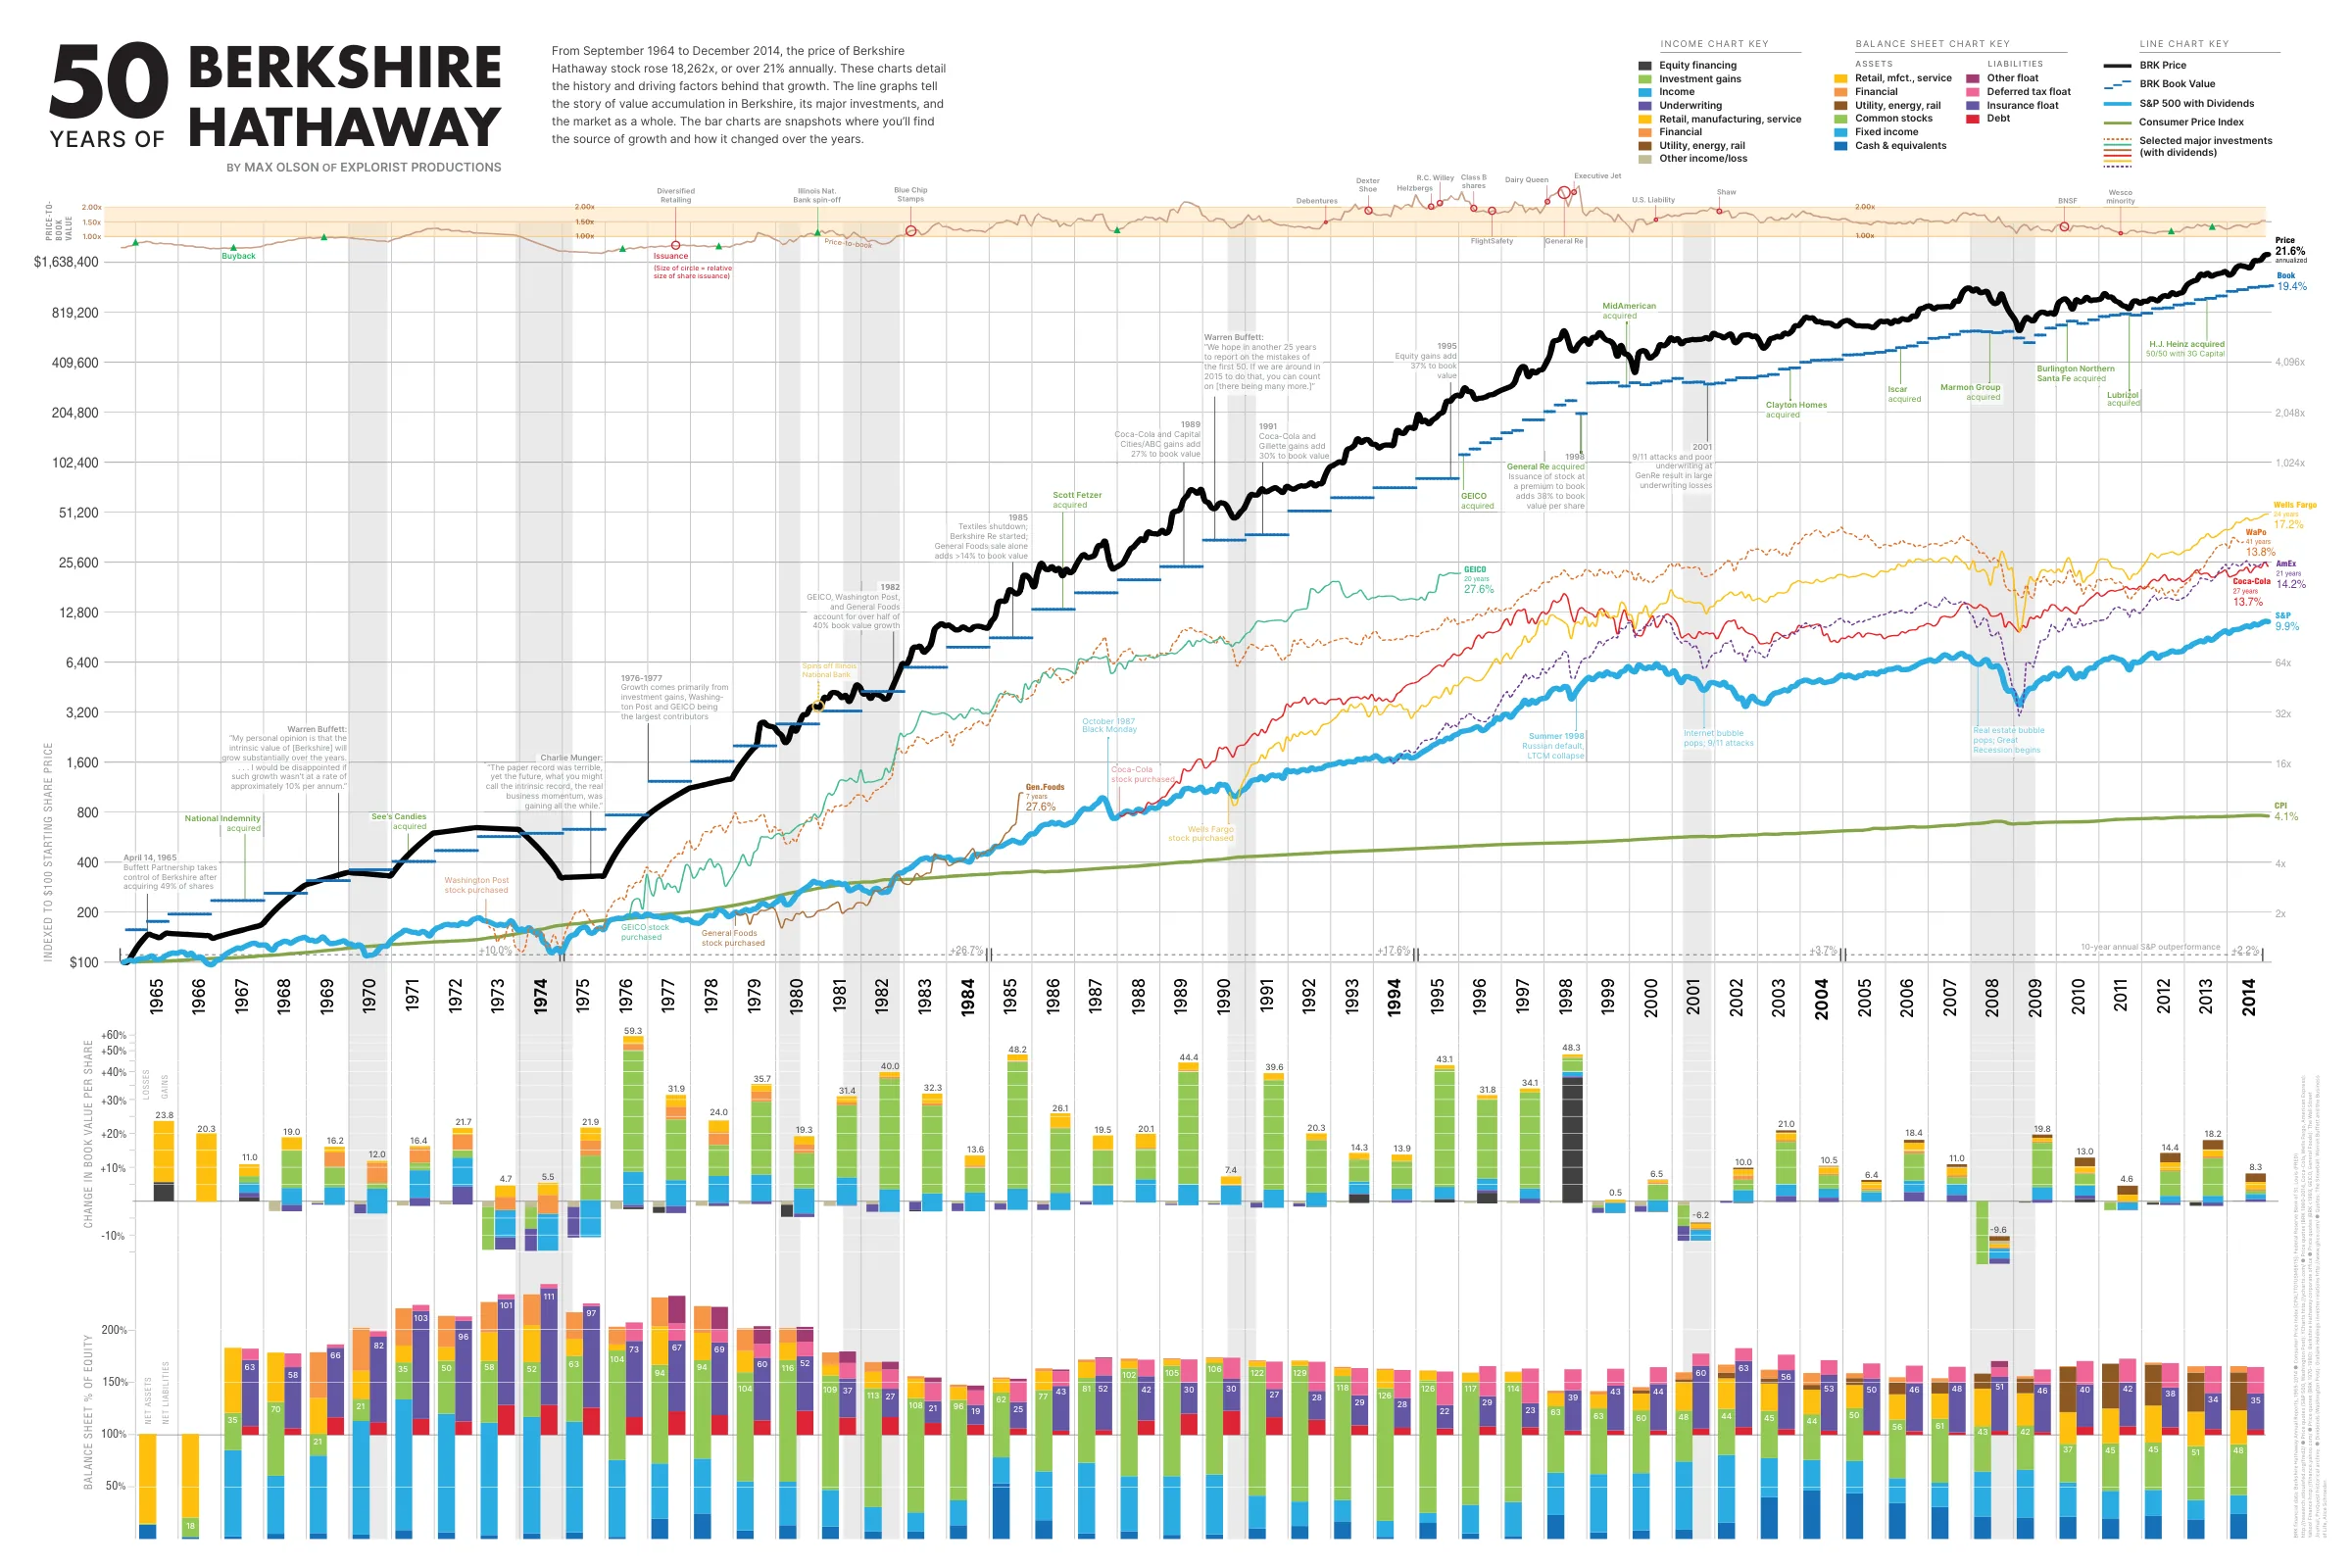
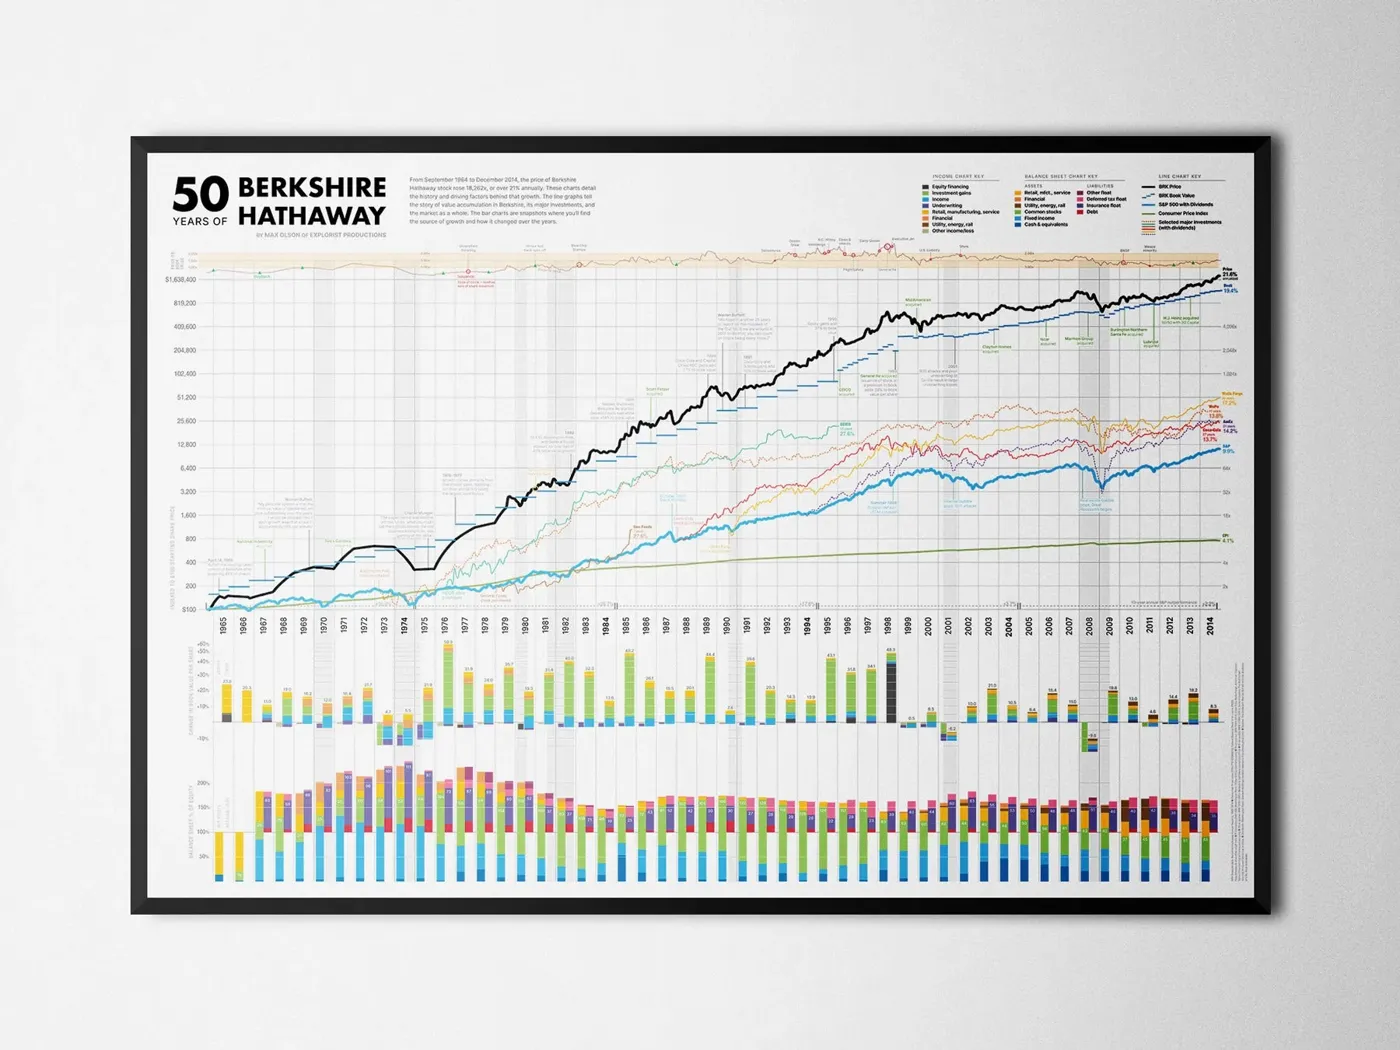
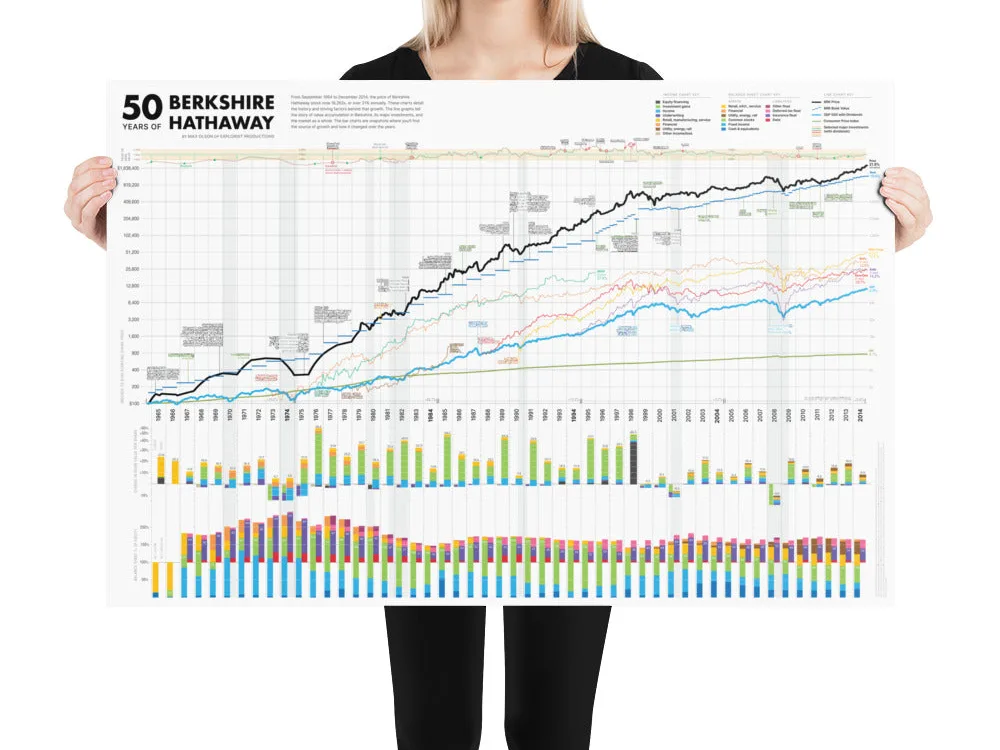
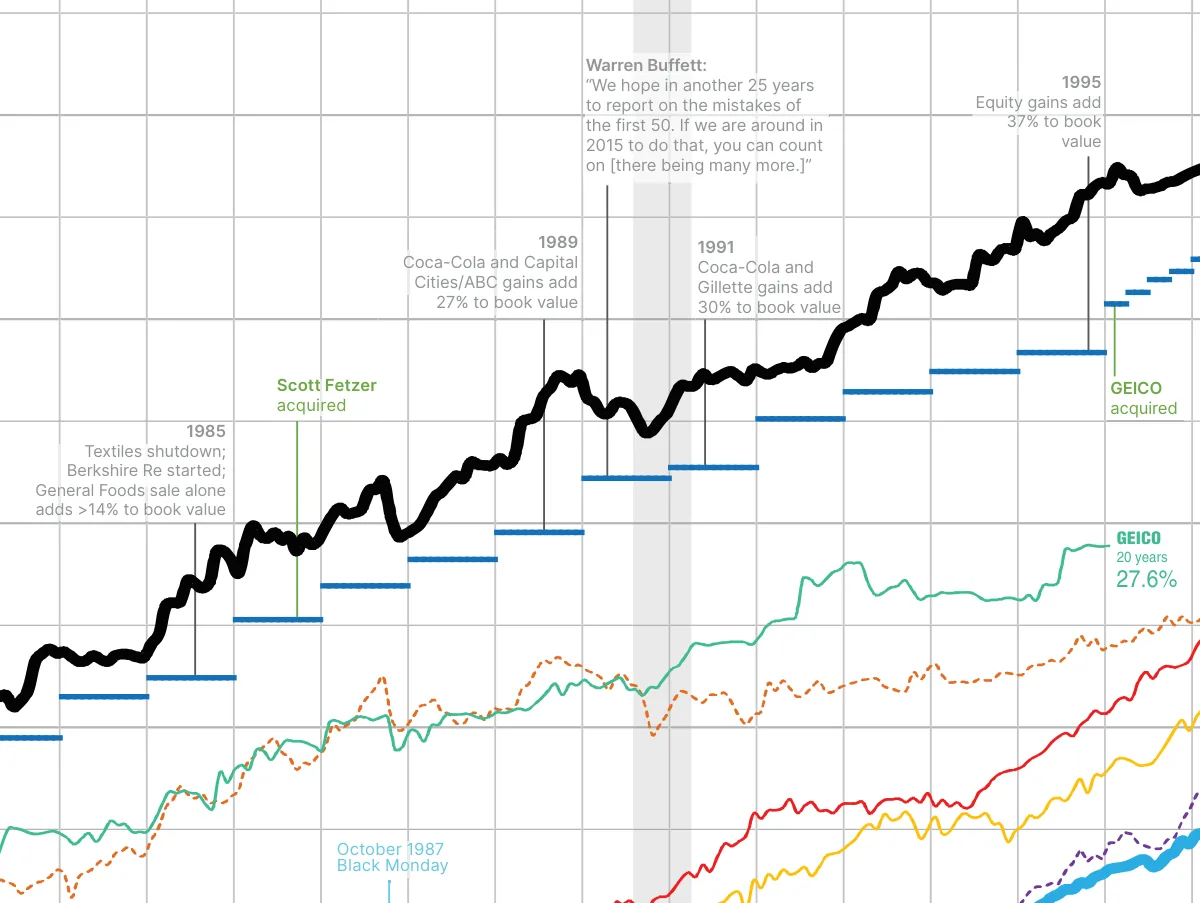
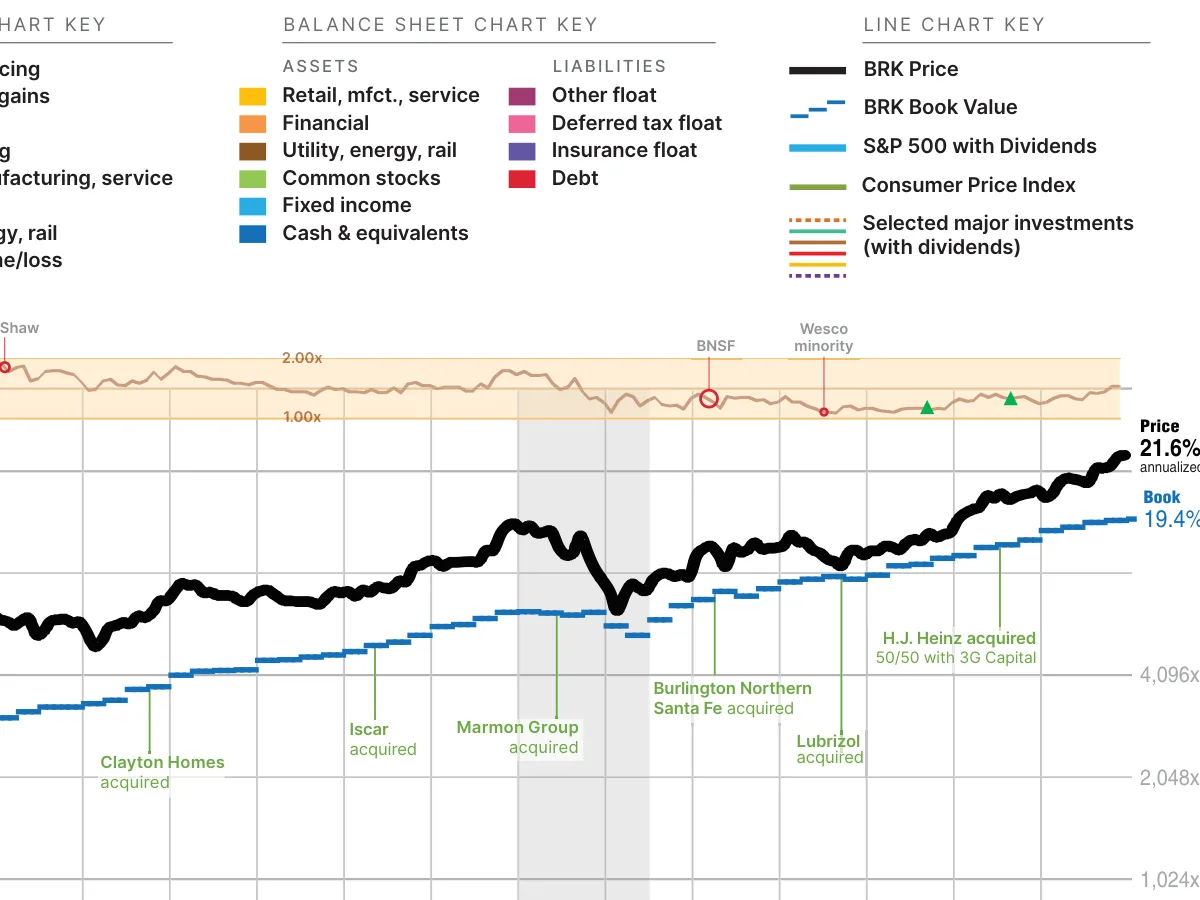
Berkshire Hathaway’s first fifty years under Warren Buffett, on one sheet. From September 1964
to December 2014 the stock rose 18,262 times, 21.6% a year. On the sheet: the price against book
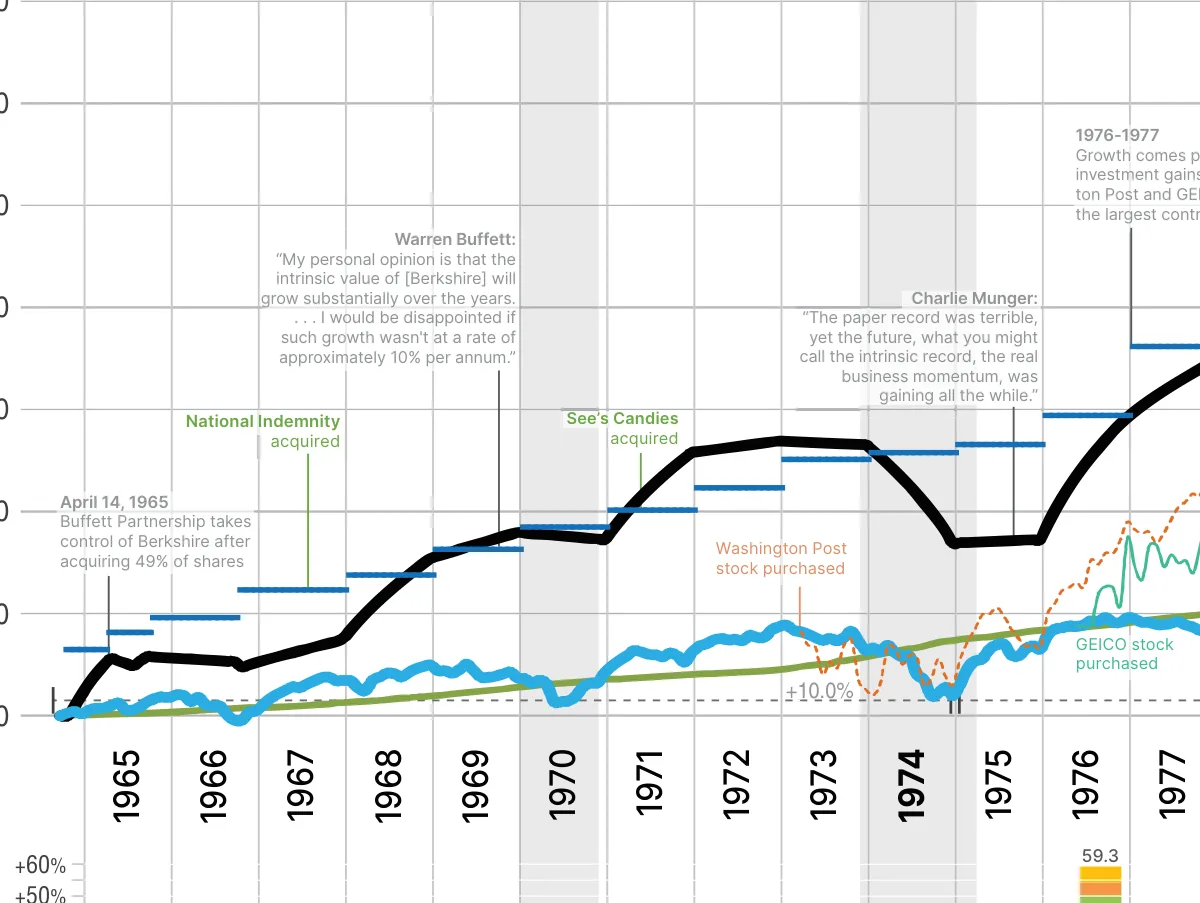
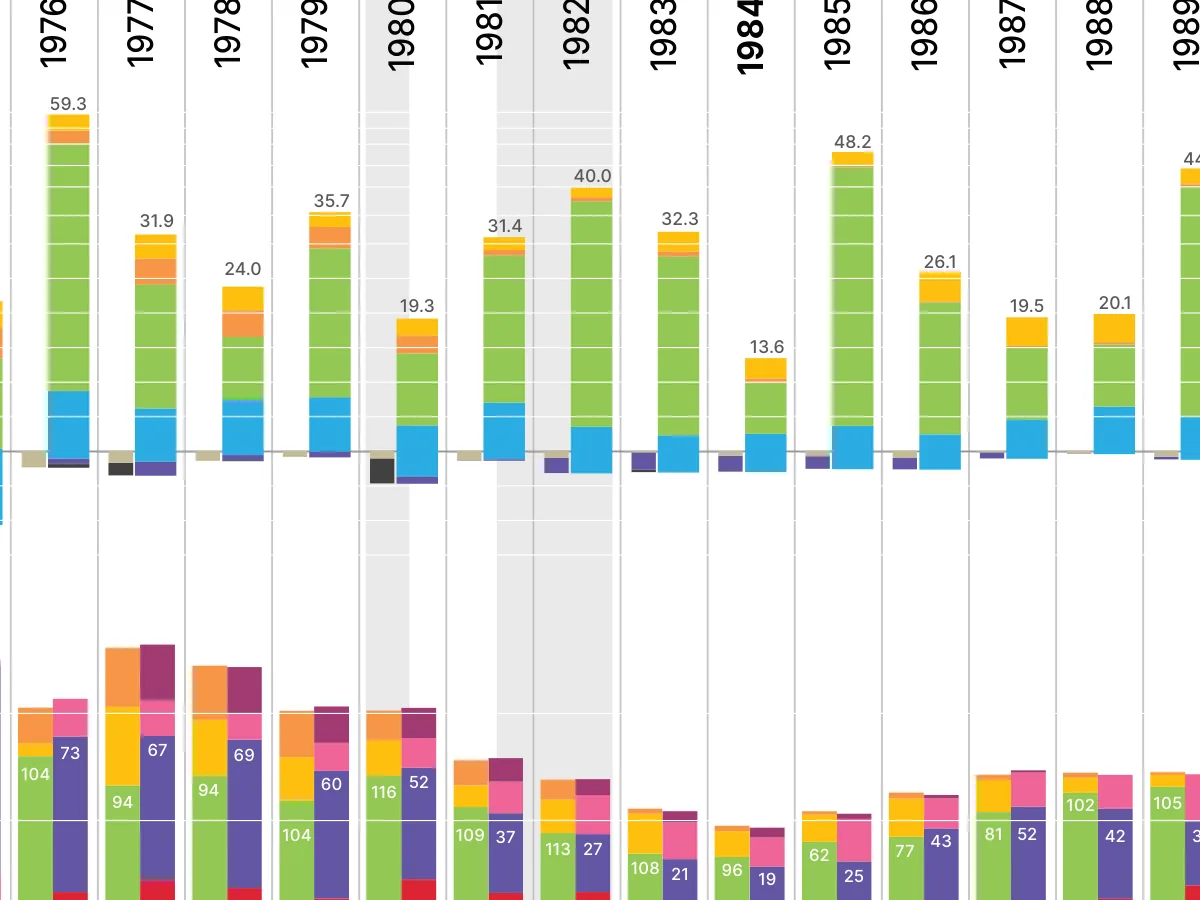
value, the S&P 500 and inflation, the big investments from GEICO to Wells Fargo, what drove
book value each year, and the balance sheet each year, float included.
We made it in 2015 from fifty years of annual reports, so the data stops at 2014. The chart
in the Berkshire Archive runs to 2024.
| Wall print | Rolled, to hang or frame | Buy |
| Framed | In a 0.75 inch alder frame | Buy |
| Years | September 1964 to December 2014 |
| Size | 36 by 24 inches |
| Paper | Matte, 10.3 mil, 189 g/m² |
| Frame | Alder, 0.75 inch, hanging hardware included |
| Printing | On demand, so allow an extra week |
| Data | Fifty years of Berkshire annual reports |